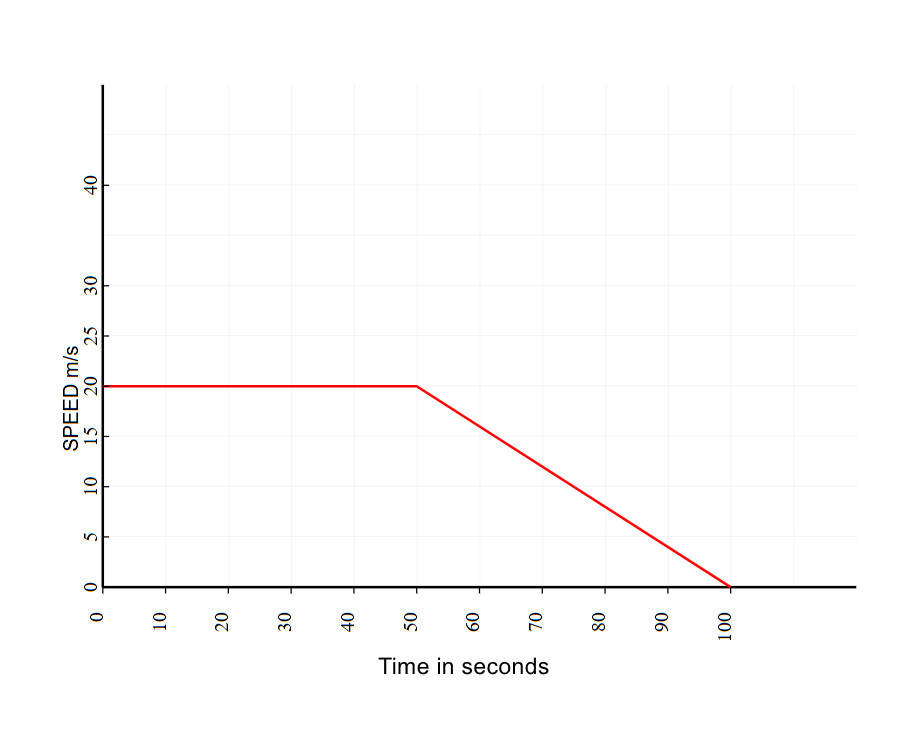
A velocity-time graph (or speed time graph) shows how the velocity or speed of an object changes over time. The vertical axis (y axis) shows speed (usually in m/s which is meters per second) and the horizontal axis ( x axis) shows the time (usually in seconds).

(1) Which part of the graph show the cyclist is travelling at a constant speed
The constant speed is shown from 0 to 50 seconds, where the line is horizontal at 20 m/s.
(2) State what is happening during the rest of the journey shown in the graph
In the rest of the journey, which is from 50 to 100 seconds, the cyclist is decelerating (slowing down) until coming to a stop.
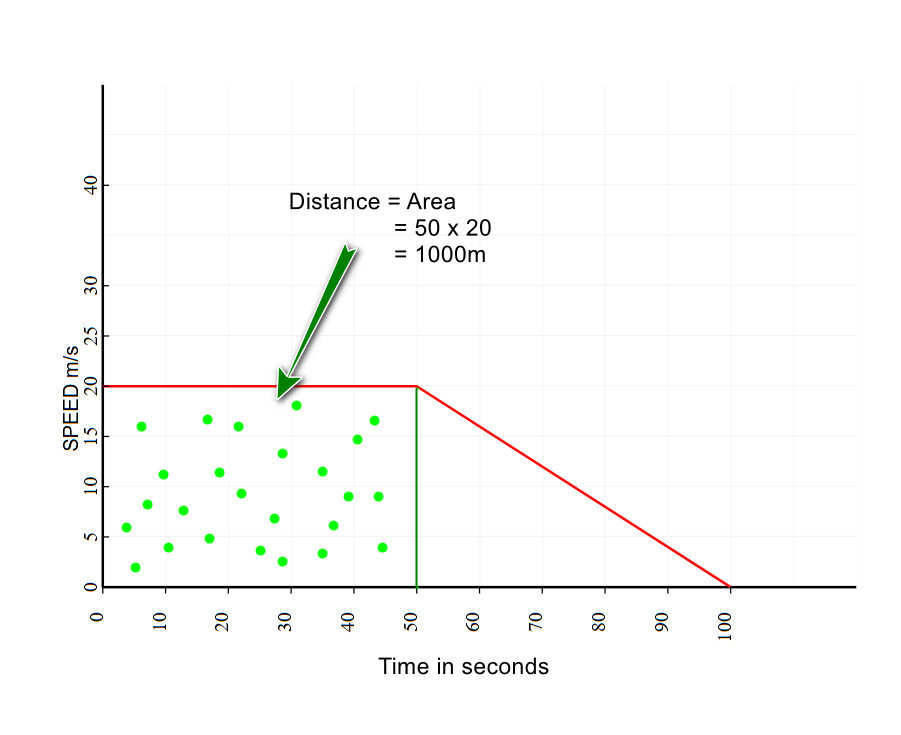
(3) Calculate the distance travelled in the first 50 seconds
The distance travelled in a speed time graph, is calculated as the area

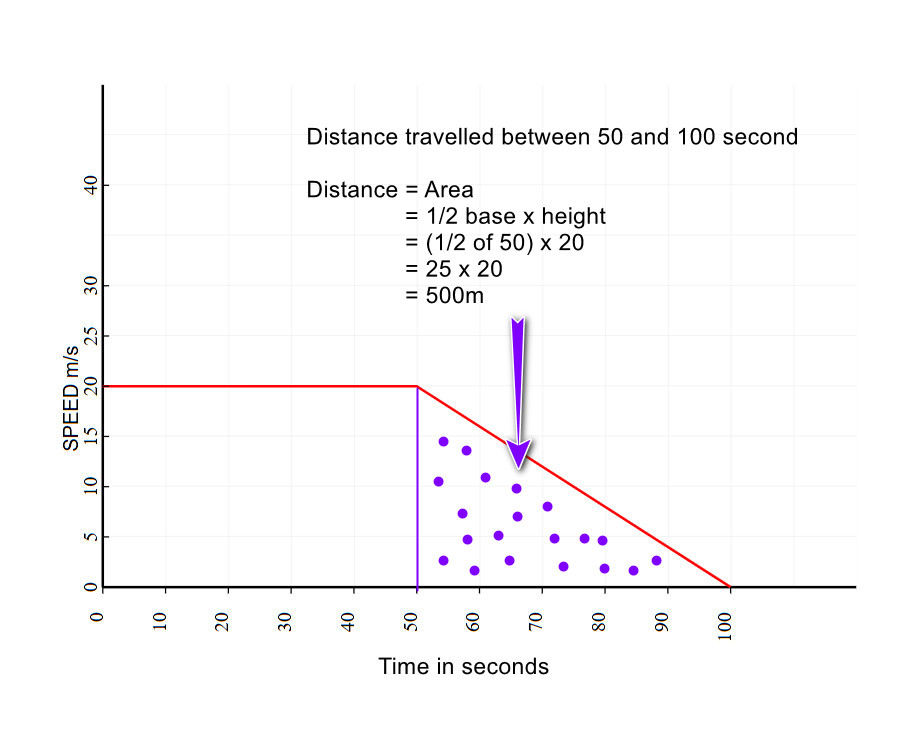
(4) Calculate the distance travelled from 50 to 100 seconds
The distance is also calculated as the area of the triangle space

(5) Calculate the total distance travelled
The total distance travelled = 1000m + 500m = 1500m
(6) Calculate the average speed in the 100 seconds journey
Average speed = Total Distance ÷ Total Time
= 1500 ÷ 100 = 15m/s


