Practice Questions:
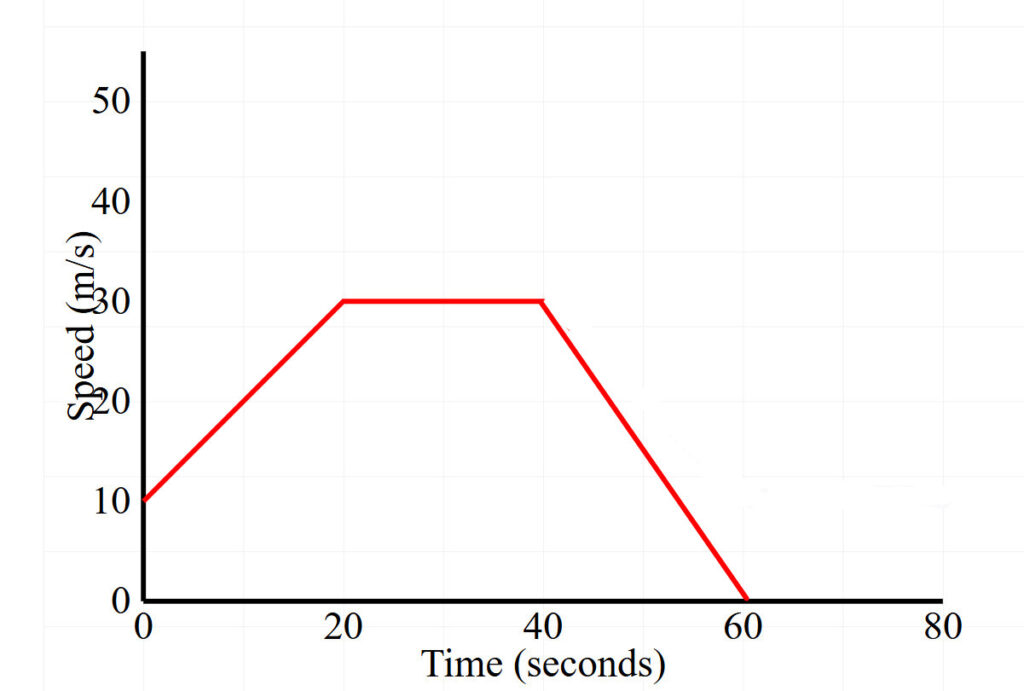
- What’s the initial speed of the car?
- During which time interval is the car moving at constant speed?
- Calculate the acceleration during the first 20 seconds
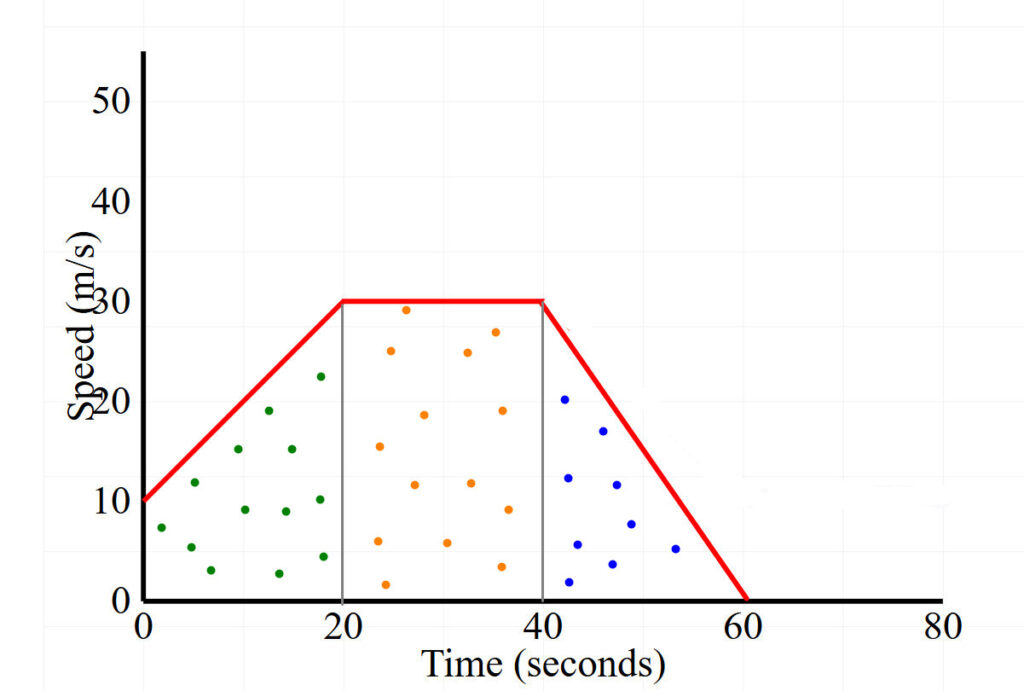
- Calculate the total distance traveled
- What’s happening to the car’s motion in the last 20 seconds?
- What’s the car’s maximum speed?
- Calculate the average speed for the entire journey
Answers
(1) Initial speed = 10 m/s (we read this from vertical axis at time = 0 seconds)
(2) Constant speed period is between 20-40 seconds and 30 m/s (the flat horizontal line)
(3) Acceleration between 0 and 20 seconds is:
- Acceleration = Change In Speed
- Change in speed = Final Speed – Starting Speed = 30m/s – 10m/s = 20 m/s
- Time taken = 20s
- Acceleration = Change in speed ÷ Time taken = 20 ÷ 20 = 1 m/s²
(4) Total distance = The full area under graph

- First section (triangle) = ½ Base x Height = ½ × 20 × 20 = 200m
- Middle section (rectangle): 20 × 30 = 600m
- Last section (triangle) = ½ Base x Height = ½ × 20 × 20 = 200m
- Total = 200 + 600 + 200 = 1000 meters
(5) The car is decelerating from 30 m/s to 10 m/s (the last downward slope)
(6) Maximum speed = 30 m/s (highest point on graph)
(7) Average speed = Total distance ÷ Total time
- = 1000 ÷ 60
- = 5.27 m/s


