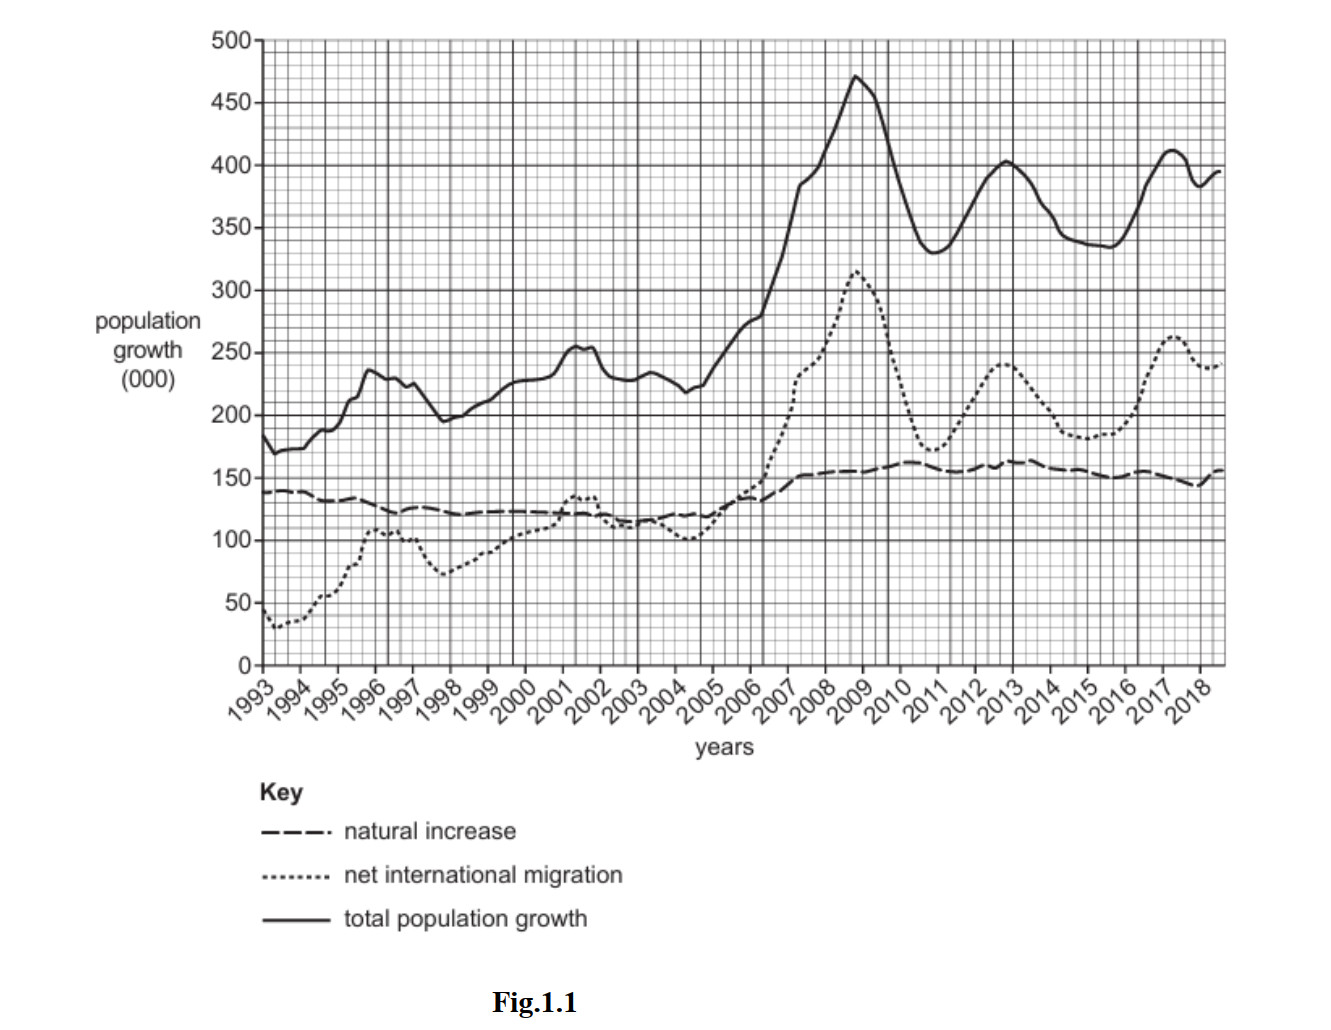
The solid line (total population growth) reaches its peak of approximately 460,000 in 2008.
Net international migration = natural increase: approximately 2006 (when the dotted and dashed lines cross, both at around 150,000) or approximately 2014 (a second crossing point at approximately 170,000). Either year is acceptable.
Total population growth decreased: 2009 (the solid line falls from its 2008 peak of ~460,000 to ~390,000) or any other year where the total line clearly slopes downward, e.g. 2010, 2013, 2014. Any valid year from Fig. 1.1 is acceptable.
Natural increase = birth rate − death rate (i.e. the number of births minus the number of deaths in a year). It shows how much the population grows due to the balance of births and deaths alone, without migration.
Net international migration = number of immigrants (people arriving) − number of emigrants (people leaving) in a year. A positive value means more people arrive than leave.
Total population growth = natural increase + net international migration. It combines both the natural change in population and the effect of migration to give the overall change in population size.
Throughout the period, natural increase was relatively stable, rising gradually from approximately 130,000 in 1993 to around 160,000–170,000 by 2018. In contrast, net international migration was far more variable and showed much greater fluctuation.
From 1993 to approximately 2005, natural increase exceeded net migration — in 1993 natural increase (~130,000) was more than three times the net migration (~40,000). Both figures were relatively low during this period.
After 2005, net migration rose sharply, overtaking natural increase around 2006–2007, and reaching a peak of approximately 305,000 in 2008 — almost double the natural increase of ~155,000 at the same time. This drove the peak in total population growth of ~460,000 in 2008.
After 2008, net migration fell steeply to approximately 170,000 by 2011 before rising again to ~245,000 in 2012. By around 2014 both measures were approximately equal again at ~170,000, before net migration rose once more to ~240,000 by 2018 while natural increase remained steady at ~160,000.
The Gambia has had a consistently high population growth rate of 4.2% for the last thirty years. ‘The main reasons include polygamy, the fact that the use of contraceptives is not common and a general reduction in infant mortality rates.’
Since 1993 a family planning programme has attempted to increase the use of modern contraceptives and reproductive health services in The Gambia. An increase in the use of contraceptives has been achieved through community health nurses and information campaigns.
- Religious and cultural beliefs: The majority of The Gambia’s population is Muslim. Some religious teachings discourage the use of artificial contraception. The practice of polygamy (having multiple wives, as mentioned in Fig. 1.2) also encourages large family sizes, so men and families may see contraception as unwanted.
- Lack of education and awareness: Many people, particularly women in rural areas, lack knowledge about contraceptive methods, how to access them, or how to use them correctly. Limited literacy and restricted access to healthcare information make it difficult to spread awareness.
- Traditional attitudes to family size: Large families are valued in The Gambia. Children provide labour on farms and are expected to support parents in old age. High social status is associated with having many children, so there is little motivation to use contraception.
Other acceptable reasons include: poverty / cost of contraceptives; women having limited decision-making power; poor access in rural areas; health workers being insufficient in number.
Population momentum is the main reason. Even if birth rates begin to fall, the existing large youthful population means there are already millions of women entering their reproductive years. The sheer number of potential mothers means the absolute number of births remains very high, even as the number of children per woman slowly falls.
Youthful age structure: The Gambia has a very high proportion of its population aged under 15. These young people will reach adulthood and begin having children over the next 20–30 years. Population growth is therefore “locked in” for a generation, regardless of current contraceptive use.
Fertility rates remain very high: Even with some increase in contraceptive use, the total fertility rate in The Gambia remains above 5 children per woman. For population to stabilise, this needs to fall to approximately 2.1 (the replacement rate). Achieving this requires decades of sustained effort, not a short-term increase in contraception.
Slow cultural change: Attitudes to family size, the role of women, and the acceptability of contraception do not change quickly. Men in particular may resist or forbid their wives from using contraception. Social norms that value large families persist even as family planning services improve.
Falling infant mortality: As mentioned in Fig. 1.2, infant mortality rates have fallen thanks to better healthcare. This means more children now survive to adulthood. Even if slightly fewer children are born, the greater survival rate keeps the total number of children alive — and future parents — very high.
Nigeria has experienced extremely rapid population growth, rising from around 45 million in 1960 to over 220 million today, and it is projected to become the world’s third most populous country by 2050. This rapid growth has caused numerous serious problems.
- Food insecurity: Nigeria cannot produce enough food to feed its growing population. Despite large areas of fertile agricultural land, rapid population growth has contributed to chronic food shortages, particularly in northern Nigeria where millions face hunger and malnutrition.
- Pressure on education: The rapidly growing school-age population means schools are severely overcrowded. Classrooms in Lagos may contain over 60 pupils. There are not enough trained teachers and the quality of education is declining, leaving many young people without adequate skills for employment.
- Healthcare strain: Hospitals and health centres are overwhelmed. Nigeria has one of the world’s lowest doctor-to-patient ratios. Infant mortality and maternal mortality remain among the highest globally, partly because the healthcare system cannot expand fast enough to serve the growing population.
- Housing shortage and urban slums: Lagos is one of the fastest growing cities in the world. A combination of high birth rates and rural-to-urban migration means millions live in informal settlements such as Makoko (a floating slum). Overcrowding is severe, and homes often lack safe water and sanitation.
- Unemployment: Nigeria’s economy cannot create jobs fast enough for its rapidly expanding working-age population. Youth unemployment exceeds 40% in some areas, causing widespread poverty and contributing to social instability and crime.
- Environmental degradation: More land is cleared for farming to feed the growing population, leading to deforestation and soil erosion. Urban sprawl around cities such as Lagos, Abuja, and Kano is consuming formerly productive farmland.
- Government debt and inadequate infrastructure: The government must borrow heavily to build schools, hospitals, roads, water systems, and electricity infrastructure for the growing population. Existing infrastructure — power supply, roads, and water provision — is already insufficient and cannot keep pace with demand.
It describes how the population is distributed across age groups (such as young dependants, economically active, and old dependants) and is often shown using a population pyramid or pie chart.
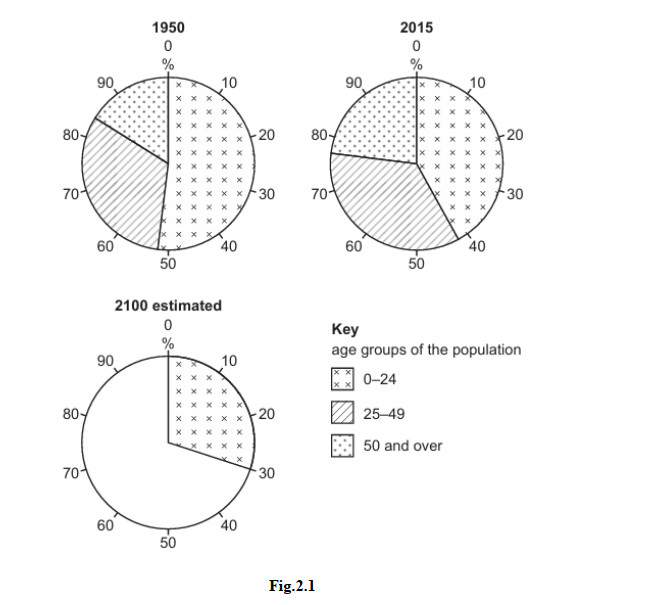
The two given values are: 25–49 years = 30%, and 50 and over = 40%.
The remaining percentage for the 0–24 age group is calculated as:
100 − 30 − 40 = 30%
To complete the diagram, draw the pie chart sectors so that:
- The 0–24 sector occupies 30% of the circle (already drawn in the original)
- The 25–49 sector occupies 30% of the circle (add using the diagonal-line pattern)
- The 50 and over sector occupies 40% of the circle (add using the dotted pattern) — this is the largest sector
Using information from Fig. 2.1 only:
- The proportion of the population aged 0–24 decreased from 1950 to 2015 — the cross-hatched sector is visibly smaller in the 2015 pie chart than in the 1950 chart.
- The proportion aged 50 and over increased from 1950 to 2015 — the dotted sector is larger in 2015 than in 1950.
- The proportion aged 25–49 remained relatively similar in both years, though it appears slightly larger in 2015.
The proportion of the population aged 0–24 decreased because birth rates fell in many countries during this period. Several reasons explain this:
- Increased access to contraception: As family planning services expanded globally, more women were able to choose when and whether to have children, reducing birth rates and therefore the proportion of young people in the population.
- Rising levels of education for women: As more girls stayed in school longer and women entered the workforce, they tended to marry later and have fewer children. This reduced birth rates, particularly in developing countries undergoing economic growth.
- Government population policies: China’s one-child policy (introduced in 1980 and in place until 2015) significantly reduced birth rates in the world’s most populous country. Other countries also introduced family planning programmes. Given that China alone accounts for around one-fifth of the world’s population, its falling birth rate strongly reduced the global 0–24 percentage.
- Urbanisation: As more people moved to cities, children became less economically useful (they are not needed as farm labour) while the cost of raising them increased. Urban families therefore tended to be smaller, reducing birth rates and the proportion of young people.
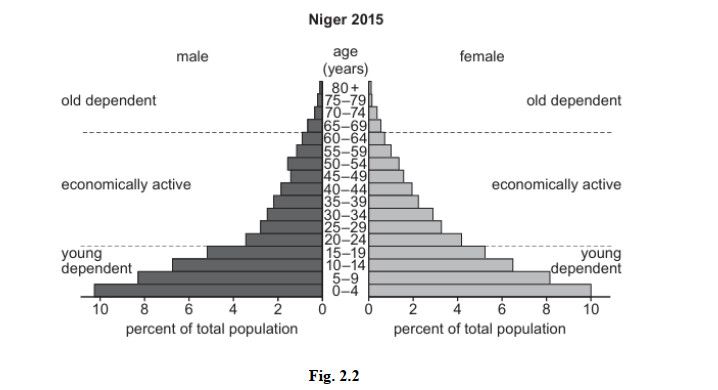
- Very wide base (large 0–4 age bar): The widest bars are at the bottom, showing a very high birth rate. Each new generation is larger than the one before it. This is typical of LEDCs where access to contraception is limited and large families are culturally valued.
- The pyramid narrows rapidly from the base: Each age group is considerably smaller than the one below it, indicating a high death rate and relatively short life expectancy. Many people die in childhood and early adulthood due to disease, malnutrition, and lack of healthcare — characteristics typical of LEDCs.
- Very small proportion of old dependents (65+): The bars for the oldest age groups (70+, 75+, 80+) are very narrow, indicating very few people survive to old age. Life expectancy in Niger is approximately 62 years, so the old dependent population is tiny compared to the large base of young dependents.
MEDCs have a significantly higher proportion of old dependents than Niger for the following reasons:
Higher life expectancy: MEDCs have well-developed healthcare systems with hospitals, trained doctors, medicines, and clean water supplies. As a result, people survive diseases and conditions that would be fatal in Niger. Life expectancy in MEDCs is typically 78–85 years, compared to around 62 years in Niger. This means far more people in MEDCs survive into the old dependent age group (65+).
Better nutrition and living standards: In MEDCs, food security is high and people receive a balanced diet throughout their lives. Malnutrition — which is a major cause of death and ill-health in LEDCs like Niger — is rare. This allows more people to live into old age.
Low birth rates in MEDCs: MEDCs have much lower birth rates than Niger, which means young people make up a relatively small proportion of the total population. With fewer young people in the pyramid, the elderly automatically represent a proportionally larger share of the population — even if the absolute number of old people is similar to an LEDC.
In Niger, high birth rates dominate the pyramid: The very large base of young people in Niger means that old dependents, even if some exist, represent only a tiny fraction of the total population. The high birth rate “dilutes” the old dependent percentage.
Japan has one of the world’s oldest populations, with over 28% of people aged 65 or over and a very low birth rate (currently around 1.2 children per woman). This creates a large dependent population — particularly old dependents — and causes serious problems for Japanese society and economy.
- Strain on pensions: The working population must financially support a rapidly growing number of retirees through tax contributions to the pension system. There are now fewer than two workers for every retiree in Japan. The pension system faces mounting deficits, and the government has been forced to raise the retirement age and reduce pension payments to keep the system from collapsing.
- Increasing healthcare costs: Elderly people require significantly more medical care than young people. Japan’s healthcare spending is among the highest in the world as a share of GDP, and costs continue to rise. There is a severe shortage of nurses, care workers, and nursing home places to support the growing elderly population.
- Labour shortages: Japan’s working-age population is shrinking. Businesses struggle to find enough workers in manufacturing, retail, agriculture, and care sectors. Labour shortages reduce economic output and have forced Japan to consider increased immigration — a major cultural shift for a traditionally closed society — and to invest heavily in robots and automation.
- Slow economic growth and rising government debt: With fewer workers producing goods and services, Japan’s economy has grown very slowly for decades. Government debt has risen to the highest level in the world relative to GDP, partly because welfare and healthcare spending for the ageing population keeps rising while the tax-paying workforce shrinks.
- Rural depopulation: As young people leave rural areas for city jobs, entire villages are left with only elderly residents. Hundreds of rural schools have closed. Some communities face extinction as the elderly population remains but is not replaced by younger people, leading to ghost towns and abandoned farmland.
- Heavy tax burden on working people: Workers face increasingly high income taxes and social insurance contributions to fund pensions and healthcare for the large elderly dependent population. This reduces workers’ disposable income and can discourage employment and enterprise.


